Graphviz Diagram Style Guide
Table of Contents
- 1. Design philosophy
- 2. The six color families
- 3. Diagram archetypes
- 4. Typography
- 5. Node conventions
- 6. Cluster conventions
- 7. Edge conventions
- 8. Backgrounds
- 9. What to avoid
- 10. Banner conventions
- 11. Real examples by archetype
- 12. Archetype: Pipeline (rankdir=LR)
- 13. Archetype: State machine (rankdir=LR, diamonds for decisions)
- 14. Archetype: Layer stack (rankdir=TB, clusters as layers)
- 15. Archetype: Network map (neato/fdp, undirected)
- 16. Archetype: Comparison (side-by-side clusters)
- 17. Archetype: Build system (rankdir=TB, make-style dependency graph)
- 18. ASCII diagram policy
- 19. Migration status (updated 2026-06-21)

1. Design philosophy
Every diagram on wal.sh is a claim about structure. The visual language should make structural relationships legible without decoration. Three principles govern the system:
- Color encodes semantics, not decoration. Each of the six color families carries a fixed meaning across all diagrams. Blue is input and primary flow. Green is output and success. Red is error and critical path. When a reader sees a green node on any page, they know it represents an output or success state without checking a legend. This contract holds across 50+ diagrams and must not be broken for aesthetic reasons.
- Diagrams carry the color; banners stay quiet. Research page banners are greyscale (728 × 90, leaderboard format). The pastel diagrams are the visual centerpiece of each page. A color banner would compete with the diagram for the reader's attention. Greyscale banners recede; diagrams advance.
- The palette is a protocol, not a preference. The Tailwind 100/700 pairs were chosen because they are widely known, machine-readable, and have accessible contrast ratios. Switching to a different palette would require updating every diagram simultaneously. The cost of that coordination is the reason the palette is documented here rather than left implicit.
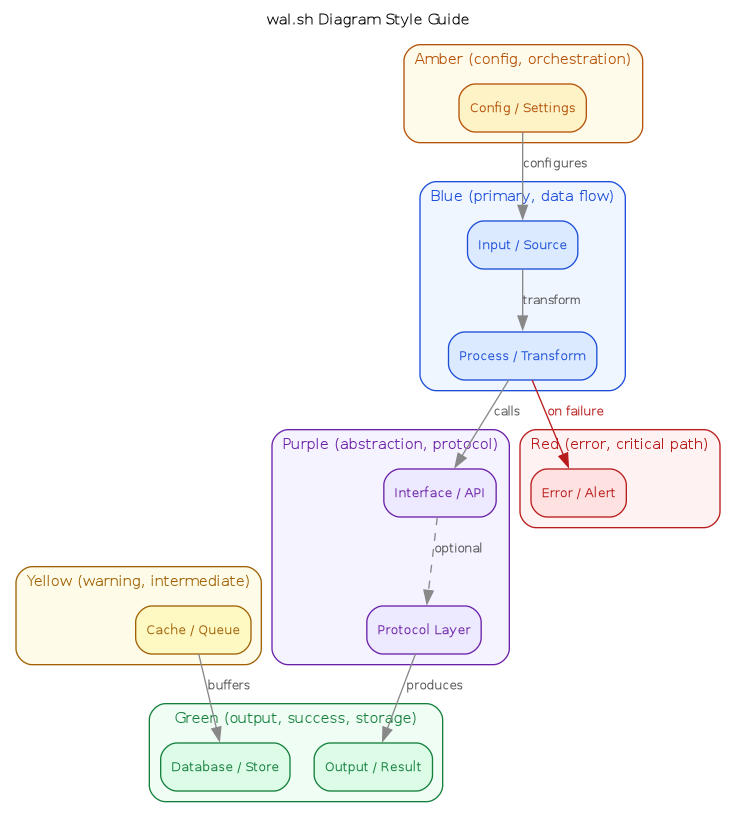
2. The six color families
| Family | Fill (100) | Border/Text (700) | Cluster BG (50) | Semantic role |
|---|---|---|---|---|
| Blue | #dbeafe |
#1d4ed8 |
#eff6ff |
Primary data flow, input, process |
| Purple | #ede9fe |
#6b21a8 |
#f5f3ff |
Abstraction, protocol, API |
| Green | #dcfce7 |
#15803d |
#f0fdf4 |
Output, success, storage |
| Amber | #fef3c7 |
#b45309 |
#fffbeb |
Config, orchestration, external |
| Yellow | #fef9c3 |
#a16207 |
#fefce8 |
Warning, intermediate, cache |
| Red | #fee2e2 |
#b91c1c |
#fef2f2 |
Error, critical path, alert |
The 100-weight fills are pastel backgrounds. The 700-weight values serve triple duty: node border, node text, and cluster label. The 50-weight is for cluster backgrounds only — lighter than the node fill so the cluster recedes behind its contents.
3. Diagram archetypes
The site uses six recurring diagram structures. Each has conventions for layout direction, color assignment, and cluster usage.
3.1. Pipeline
Pipelines show data flowing through sequential transformations. They read
left to right (rankdir=LR). Color follows the data lifecycle: blue for
ingestion, amber for processing, green for output. Intermediate stores
(caches, queues) are yellow.
rankdir=LR

[blue: source] → [blue: ingest] → [amber: transform] → [green: output]
                                          ↓
                                   [yellow: cache]
Examples: diagram-rag-pipeline, diagram-ci-cd-pipeline,
diagram-2019-ml-pipeline, jq/diagram-pipeline,
kubeflow/diagram-pipeline.
Clusters group stages that share a concern (ingestion plane, serving plane). Each cluster border matches the dominant color family of its contents.
3.2. Layer stack
Layer stacks show architectural layers from top (user-facing) to bottom
(substrate). They read top to bottom (rankdir=TB). Each layer is a
cluster with a distinct color family. The top layer is typically blue
(closest to the user); lower layers shift through purple, amber, and green.
rankdir=TB

┌─ blue: Model layer ─────────────┐
│  [blue: Opus]  [blue: Haiku]    │
└─────────────────────────────────┘
         ↓
┌─ purple: Capability layer ──────┐
│  [purple: hooks] [purple: MCP]  │
└─────────────────────────────────┘
         ↓
┌─ green: State layer ────────────┐
│  [green: settings] [green: db]  │
└─────────────────────────────────┘
Examples: 2026-q2-claude-code-features/diagram-feature-surface,
diagram-tool-systems-layers, diagram-llm-frameworks-taxonomy,
2026-q2-cloudflare-agents/diagram-stack.
The convention: each layer gets its own color family, and the cluster
border matches the nodes inside it. Cross-layer edges use the default grey
(#888); failure-path edges use red.
3.3. Comparison
Comparisons place two or more systems side by side. They use rankdir=TB
with clusters arranged horizontally via rank=same or Graphviz's natural
layout. Each system gets a distinct color family. The contrast between
cluster colors is the primary visual signal.
rankdir=TB

┌─ blue: System A ──┐     ┌─ amber: System B ──┐
│  [blue: node]      │     │  [amber: node]      │
│  [blue: node]      │     │  [amber: node]      │
└────────────────────┘     └─────────────────────┘
Examples: 2026-agent-isolation-freebsd-jails/diagram-isolation-comparison
(blue=DIY jails, amber=Cloudflare sandbox),
diagram-datalayer-schema-compare (four schema formats, four colors),
diagram-eda-vs-actor, 2025-terminal-ai-agents/diagram-comparison.
The rule: never use the same color family for both sides of a comparison. The reader should distinguish the two systems by color alone.
3.4. State machine
State machines show transitions between states. They read left to right
(rankdir=LR). Each state gets a color that reflects its semantic nature:
green for healthy/fresh, amber for degraded/stale, blue for
active/processing, purple for fallback, red for terminal/error.
rankdir=LR

[green: fresh] → [amber: stale] → [blue: revalidating] → [green: fresh]
                       ↓                    ↓
                [purple: serve-stale]  [red: evicted]
Example: diagram-cache-states (HTTP cache lifecycle per RFC 9111).
State machines are the only archetype where individual nodes routinely use different color families. The color of each node is its most important visual attribute — it tells the reader whether the state is healthy, degraded, or terminal before they read the label.
3.5. Process loop
Process loops show a cyclical workflow with named phases. They read left to
right (rankdir=LR) to emphasize the forward flow, with a dashed
feedback edge closing the loop. Each phase is a cluster with a distinct
color family, typically cycling through blue, purple, amber, green.
rankdir=LR

┌─ blue: Propose ─┐  →  ┌─ purple: Challenge ─┐  →  ┌─ amber: Defend ─┐  →  ┌─ green: Refine ─┐
│  [blue: scan]    │     │  [purple: question]  │     │  [amber: answer] │     │  [green: summary]│
└──────────────────┘     └──────────────────────┘     └─────────────────┘     └─────────────────┘
         ↑                                                                             │
         └─────────────────────── dashed: resubmit ────────────────────────────────────┘
Example: 2026-elenctic-vibe-code-review/diagram-review-loop.
The feedback edge (green → blue) is always dashed and uses the default grey. Exception nodes (e.g., operational override) use red and connect with red dashed edges.
3.6. Ecosystem map
Ecosystem maps show the relationships between tools, libraries, or
systems in a domain. They use rankdir=TB with clusters grouping related
items by category. Color assignment follows function: blue for core
implementations, purple for protocols/standards, green for outputs/tooling,
amber for configuration/build, yellow for community/ecosystem, red for
deprecated or risky components.
rankdir=TB

┌─ blue: Core ────────┐
│  [blue: impl A]      │
│  [blue: impl B]      │
└──────────────────────┘
         ↓
┌─ purple: Protocols ──┐     ┌─ amber: Build ──────┐
│  [purple: spec]       │     │  [amber: toolchain]  │
└───────────────────────┘     └──────────────────────┘
Examples: diagram-scheme-llm-toolkit,
2025-terminal-ai-agents/diagram-ecosystem,
diagram-clojure-ecosystem.
4. Typography
All text uses fontname"Helvetica"=. Three sizes, no exceptions:
| Element | fontsize |
|---|---|
| Graph label | 11 |
| Node label | 10 |
| Edge label | 9 |
5. Node conventions
Every node uses shape=box with style"rounded,filled"=. The three color
attributes are mandatory and must come from the same family:
If a node has fillcolor but is missing color or fontcolor, the diagram
is broken. Black text on a pastel background means a missing fontcolor.
5.1. Special shapes
shape=note: used for annotation nodes (reviewee, reviewer, legend entries). Still uses the palette; still needs all three color attributes.shape=diamond: used for decision points in pipelines. Typically amber (config/decision semantics).shape=plain: used for invisible structural nodes (start/end markers in state machines). No fill, no border.
6. Cluster conventions
Clusters group related nodes. The default style is border-only — a colored border with a white interior. This keeps the diagram clean: the pastel node fills carry the color, and the cluster border frames them without adding visual weight.
Use style"rounded,filled"= with a 50-weight fillcolor only when
the cluster background needs to distinguish a region from the graph
background (e.g., layer stacks where the layers must be visually
separated, or comparison diagrams where two systems sit side by side and
need distinct background tints). Prefer border-only for most diagrams.
7. Edge conventions
- Default:
color"#888", =fontcolor"#555"= - Failure/error paths:
color"#b91c1c", =fontcolor"#b91c1c"= - Optional/fallback:
style=dashed - Deprecated/pressure:
style=dotted - Feedback loops:
style=dashedwith default grey (the loop is structural, not semantic)
8. Backgrounds
- Graph:
bgcolor=white(always) - Cluster: 50-weight of the cluster's color family
- Never use
#fafafafor clusters; it has no semantic meaning
9. What to avoid
- Shorthand hex (
#369,#d63): always use full 6-digit hex - Named HTML colors (
lightblue,yellow): not reproducible across renderers - Dark backgrounds with light text: inverts the site's light theme
- Hard saturated fills: always use the 100-weight pastel
- Non-Helvetica fonts: the site CSS uses sans-serif
- Neutral grey clusters (
#444/#fafafa): every cluster should use a color family that matches the semantic role of its contents - Missing
fontcolor: if you see black text on a pastel node, thefontcolorattribute is missing
10. Banner conventions
Research page banners are 728 × 90 pixels, greyscale, leaderboard format.
magick input.png -resize 728x90^ -gravity center -extent 728x90 -colorspace Gray output.png
Org reference:
#+ATTR_HTML: :alt Description :class banner-leaderboard :width 728 :height 90
[[file:banner.png]]
11. Real examples by archetype
| Archetype | Canonical example | Page |
|---|---|---|
| Pipeline | diagram-rag-pipeline |
RAG system |
| Pipeline | diagram-observability |
REPL-driven flight tracking |
| Layer stack | diagram-feature-surface |
Claude Code features Q2 |
| Layer stack | diagram-layers |
Unix V4 |
| Comparison | diagram-isolation-comparison |
Agent isolation (jails) |
| State machine | diagram-cache-states |
HTTP cache (RFC 9111) |
| State machine | diagram-order-states |
TLA+ system design |
| State machine | diagram-process-lifecycle |
Unix V4 |
| Process loop | diagram-review-loop |
Elenctic vibe code review |
| Ecosystem map | diagram-ecosystem |
Unix V4 games |
| Ecosystem map | diagram-scheme-llm-toolkit |
Scheme LLM toolkit |
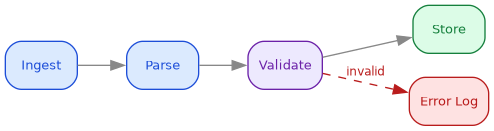
12. Archetype: Pipeline (rankdir=LR)
Data flows left to right through processing stages. Blue for input, green for output, red for error paths.
digraph pipeline {
    rankdir=LR;
    bgcolor=white;
    node [shape=box, style="rounded,filled", fontname="Helvetica", fontsize=10];
    edge [color="#888888", fontcolor="#555555", fontname="Helvetica", fontsize=9];

    ingest [label="Ingest", fillcolor="#dbeafe", color="#1d4ed8", fontcolor="#1d4ed8"];
    parse [label="Parse", fillcolor="#dbeafe", color="#1d4ed8", fontcolor="#1d4ed8"];
    validate [label="Validate", fillcolor="#ede9fe", color="#6b21a8", fontcolor="#6b21a8"];
    store [label="Store", fillcolor="#dcfce7", color="#15803d", fontcolor="#15803d"];
    err [label="Error Log", fillcolor="#fee2e2", color="#b91c1c", fontcolor="#b91c1c"];

    ingest -> parse -> validate -> store;
    validate -> err [label="invalid", color="#b91c1c", fontcolor="#b91c1c", style=dashed];
}
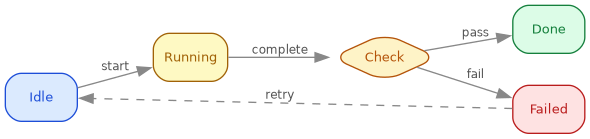
13. Archetype: State machine (rankdir=LR, diamonds for decisions)
States as rounded boxes, transitions as edges. Amber for decision points, green for terminal states.
digraph states {
    rankdir=LR;
    bgcolor=white;
    node [shape=box, style="rounded,filled", fontname="Helvetica", fontsize=10];
    edge [color="#888888", fontcolor="#555555", fontname="Helvetica", fontsize=9];

    idle [label="Idle", fillcolor="#dbeafe", color="#1d4ed8", fontcolor="#1d4ed8"];
    running [label="Running", fillcolor="#fef9c3", color="#a16207", fontcolor="#a16207"];
    check [label="Check", shape=diamond, fillcolor="#fef3c7", color="#b45309", fontcolor="#b45309"];
    done [label="Done", fillcolor="#dcfce7", color="#15803d", fontcolor="#15803d"];
    failed [label="Failed", fillcolor="#fee2e2", color="#b91c1c", fontcolor="#b91c1c"];

    idle -> running [label="start"];
    running -> check [label="complete"];
    check -> done [label="pass"];
    check -> failed [label="fail"];
    failed -> idle [label="retry", style=dashed];
}
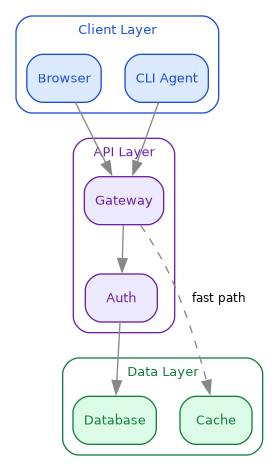
14. Archetype: Layer stack (rankdir=TB, clusters as layers)
Vertical layers with clusters. Each layer is a cluster with border-only style. Use for architecture diagrams.
digraph layers {
    rankdir=TB;
    bgcolor=white;
    node [shape=box, style="rounded,filled", fontname="Helvetica", fontsize=10];
    edge [color="#888888", fontname="Helvetica", fontsize=9];

    subgraph cluster_client {
        label="Client Layer";
        style="rounded"; color="#1d4ed8"; fontcolor="#1d4ed8"; fontname="Helvetica"; fontsize=10;
        browser [label="Browser", fillcolor="#dbeafe", color="#1d4ed8", fontcolor="#1d4ed8"];
        cli [label="CLI Agent", fillcolor="#dbeafe", color="#1d4ed8", fontcolor="#1d4ed8"];
    }

    subgraph cluster_api {
        label="API Layer";
        style="rounded"; color="#6b21a8"; fontcolor="#6b21a8"; fontname="Helvetica"; fontsize=10;
        gateway [label="Gateway", fillcolor="#ede9fe", color="#6b21a8", fontcolor="#6b21a8"];
        auth [label="Auth", fillcolor="#ede9fe", color="#6b21a8", fontcolor="#6b21a8"];
    }

    subgraph cluster_data {
        label="Data Layer";
        style="rounded"; color="#15803d"; fontcolor="#15803d"; fontname="Helvetica"; fontsize=10;
        db [label="Database", fillcolor="#dcfce7", color="#15803d", fontcolor="#15803d"];
        cache [label="Cache", fillcolor="#dcfce7", color="#15803d", fontcolor="#15803d"];
    }

    browser -> gateway; cli -> gateway;
    gateway -> auth -> db;
    gateway -> cache [style=dashed, label="fast path"];
}
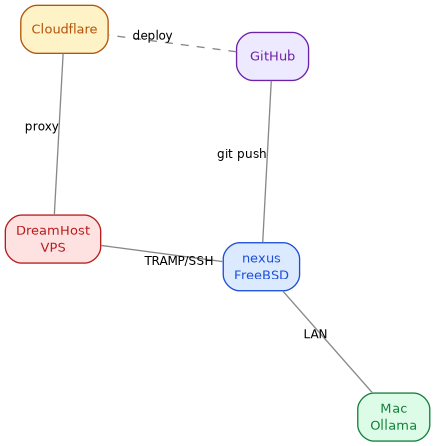
15. Archetype: Network map (neato/fdp, undirected)
Peer-to-peer or mesh relationships. Use :cmd neato or :cmd fdp
for spring-model layout. No hierarchy.
graph network {
    bgcolor=white;
    node [shape=box, style="rounded,filled", fontname="Helvetica", fontsize=10];
    edge [color="#888888", fontname="Helvetica", fontsize=9, len=2.0];

    nexus [label="nexus\nFreeBSD", fillcolor="#dbeafe", color="#1d4ed8", fontcolor="#1d4ed8"];
    mac [label="Mac\nOllama", fillcolor="#dcfce7", color="#15803d", fontcolor="#15803d"];
    vps [label="DreamHost\nVPS", fillcolor="#fee2e2", color="#b91c1c", fontcolor="#b91c1c"];
    gh [label="GitHub", fillcolor="#ede9fe", color="#6b21a8", fontcolor="#6b21a8"];
    cf [label="Cloudflare", fillcolor="#fef3c7", color="#b45309", fontcolor="#b45309"];

    nexus -- mac [label="LAN"];
    nexus -- vps [label="TRAMP/SSH"];
    nexus -- gh [label="git push"];
    vps -- cf [label="proxy"];
    gh -- cf [label="deploy", style=dashed];
}
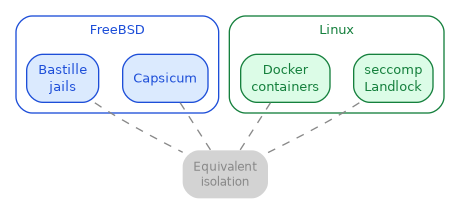
16. Archetype: Comparison (side-by-side clusters)
Two or more systems compared. Each system is a cluster, shared edges show equivalences or differences.
digraph comparison {
    rankdir=TB;
    bgcolor=white;
    node [shape=box, style="rounded,filled", fontname="Helvetica", fontsize=10];
    edge [color="#888888", fontname="Helvetica", fontsize=9];

    subgraph cluster_freebsd {
        label="FreeBSD";
        style="rounded"; color="#1d4ed8"; fontcolor="#1d4ed8"; fontname="Helvetica"; fontsize=10;
        jails [label="Bastille\njails", fillcolor="#dbeafe", color="#1d4ed8", fontcolor="#1d4ed8"];
        capsicum [label="Capsicum", fillcolor="#dbeafe", color="#1d4ed8", fontcolor="#1d4ed8"];
    }

    subgraph cluster_linux {
        label="Linux";
        style="rounded"; color="#15803d"; fontcolor="#15803d"; fontname="Helvetica"; fontsize=10;
        docker [label="Docker\ncontainers", fillcolor="#dcfce7", color="#15803d", fontcolor="#15803d"];
        seccomp [label="seccomp\nLandlock", fillcolor="#dcfce7", color="#15803d", fontcolor="#15803d"];
    }

    equiv [label="Equivalent\nisolation", shape=plaintext, fontname="Helvetica", fontsize=9, fontcolor="#888888"];

    jails -> equiv [style=dashed, arrowhead=none];
    docker -> equiv [style=dashed, arrowhead=none];
    capsicum -> equiv [style=dashed, arrowhead=none];
    seccomp -> equiv [style=dashed, arrowhead=none];
}
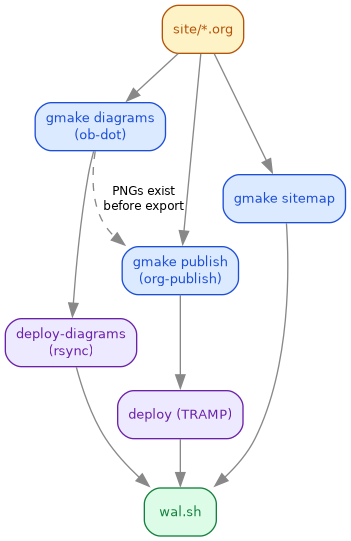
17. Archetype: Build system (rankdir=TB, make-style dependency graph)
Targets as nodes, dependencies as edges. Use amber for inputs, green for final artifacts, blue for intermediate.
digraph build {
    rankdir=TB;
    bgcolor=white;
    node [shape=box, style="rounded,filled", fontname="Helvetica", fontsize=10];
    edge [color="#888888", fontname="Helvetica", fontsize=9];

    src [label="site/*.org", fillcolor="#fef3c7", color="#b45309", fontcolor="#b45309"];
    diagrams [label="gmake diagrams\n(ob-dot)", fillcolor="#dbeafe", color="#1d4ed8", fontcolor="#1d4ed8"];
    publish [label="gmake publish\n(org-publish)", fillcolor="#dbeafe", color="#1d4ed8", fontcolor="#1d4ed8"];
    sitemap [label="gmake sitemap", fillcolor="#dbeafe", color="#1d4ed8", fontcolor="#1d4ed8"];
    deploy_diag [label="deploy-diagrams\n(rsync)", fillcolor="#ede9fe", color="#6b21a8", fontcolor="#6b21a8"];
    deploy_html [label="deploy (TRAMP)", fillcolor="#ede9fe", color="#6b21a8", fontcolor="#6b21a8"];
    live [label="wal.sh", fillcolor="#dcfce7", color="#15803d", fontcolor="#15803d"];

    src -> diagrams -> deploy_diag -> live;
    src -> publish -> deploy_html -> live;
    src -> sitemap -> live;
    diagrams -> publish [style=dashed, label="PNGs exist\nbefore export"];
}
18. ASCII diagram policy
Any ASCII arrow diagram in a #+begin_example block that represents a data
flow, state machine, or architecture should be converted to a graphviz dot
diagram for visual consistency. ASCII directory trees (├── .config/) and
inline prose arrows (agent loops 200\times \to costs $0.00) stay as text.
19. Migration status (updated 2026-06-21)
All diagrams use the canonical palette. The mermaid-to-dot migration is
complete: 54 of 55 mermaid blocks converted (1 display-only example
remains in this guide). The site now has 171 dot blocks with :file across
92 org files, all with :tangle targets. Zero loose .dot files under
site/.
See Diagram Generation on FreeBSD for backend availability and Org-Mode Graphviz Publish Workflow for the end-to-end pipeline test.