Table of Contents
On May 19, 2026, a thunderstorm knocked out power to 51,000 homes in Boston (Universal Hub). Our local ADS-B receiver captured the aviation impact in real-time — a dataset ripe for REPL-driven exploration.
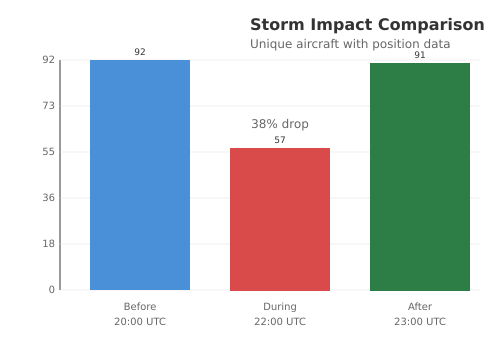
1. The Signal: Message Volume Drop
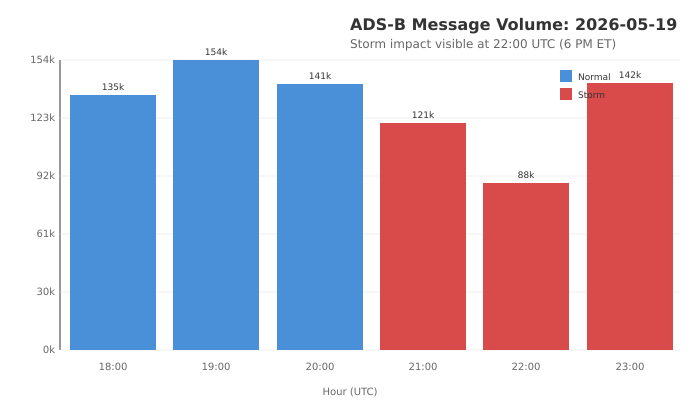
At 22:00 UTC (6 PM ET), ADS-B message volume dropped 37% — from 141,751 to 88,880 messages/hour. Not receiver failure; aircraft absence. This drop occurred 30 minutes after the first FAA ground stop (see FAA correlation below).
2. The REPL Session
This analysis was not planned. It emerged step by step — each evaluation informed the next hypothesis.
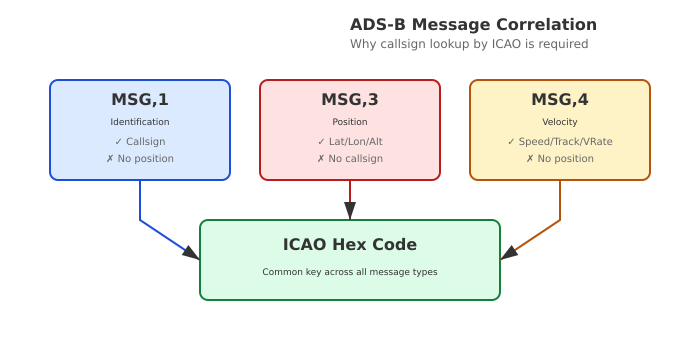
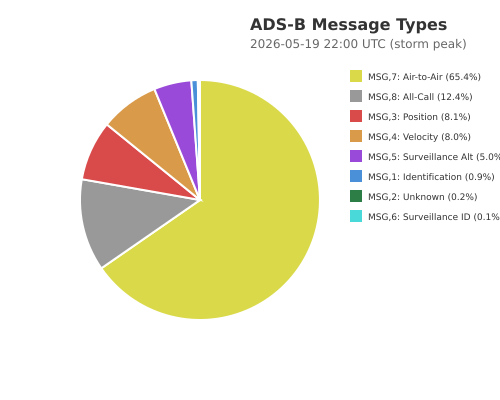
;; STEP 1: Load and count
(def storm-data (load-data "2026-05-19" [21 22 23]))
(count storm-data)
;; => 352,003 messages in 3 hours

;; STEP 2: Message type distribution
(->> storm-data (map :msg-type) frequencies)
;; => {"3" 27782, "4" 39241, "7" 205789, "8" 68109}
;; MSG,3 = positions, MSG,1 = callsigns

;; STEP 3: Correlate callsigns to positions via ICAO hex
(def icao->cs (build-callsign-map storm-data))
;; => 203 unique aircraft

;; STEP 4: Hypothesis — are aircraft holding?
(def by-icao (group-by :icao (filter :lat storm-data)))

;; STEP 5: Calculate geographic spread per aircraft
(defn spread-nm [positions]
  (let [lats (map :lat positions)
        lons (map :lon positions)]
    (apply max (map #(haversine-nm (mean lats) (mean lons) (:lat %) (:lon %))
                    positions))))

;; STEP 6: The threshold wasn't known until step 5 revealed the distribution
(->> by-icao
     (map (fn [[icao ps]]
            {:callsign (get icao->cs icao icao)
             :positions (count ps)
             :spread (spread-nm ps)
             :alt-range (- (apply max (keep :altitude ps))
                           (apply min (keep :altitude ps)))}))
     (filter #(< (:spread %) 15))
     (filter #(< (:alt-range %) 3000))
     (sort-by :positions >)
     (take 10))
;; => JBU834 (347 pos, 13.5nm), AAL2595 (295, 11.3nm), SWR52 (261, 14.3nm)
The filter predicate at step 6 — < 15nm spread, < 3000ft altitude
range — could not have been written in advance. The thresholds came
from inspecting the distribution at step 5. This is the non-zero-shot
argument: the analysis responds to its own output.
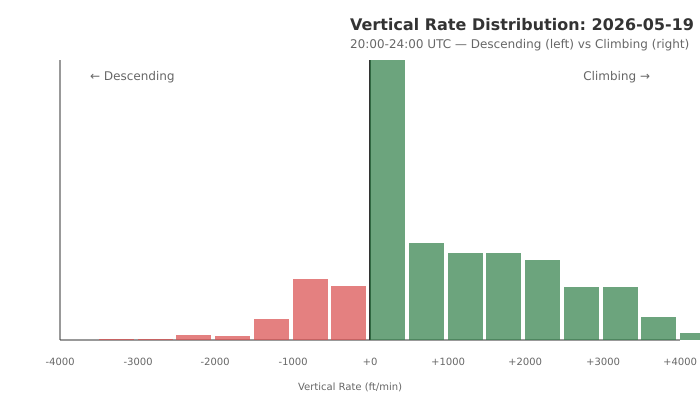
3. Holding Patterns: Where Were They?
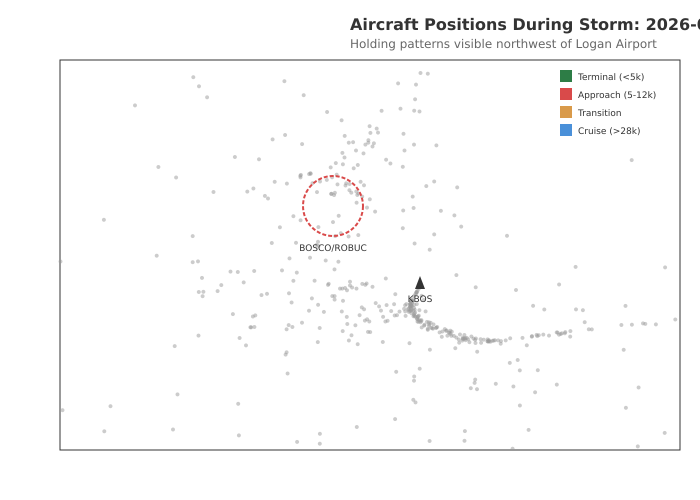
Position data revealed 56 aircraft in holding patterns northwest of Logan, centered on the BOSCO/ROBUC holding fixes at ~42.45°N, 71.08°W.
| Callsign | Airline | Positions | Spread | Altitude |
|---|---|---|---|---|
| JBU834 | JetBlue | 347 | 13.5nm | 5-7k ft |
| AAL2595 | American | 295 | 11.3nm | 4-6k ft |
| SWR52 | Swiss | 261 | 14.3nm | 6k ft |
| SWA1797 | Southwest | 126 | 5.7nm | 6k ft |
Swiss 52 reported 261 positions with only 25-foot altitude variance — textbook holding at assigned altitude.
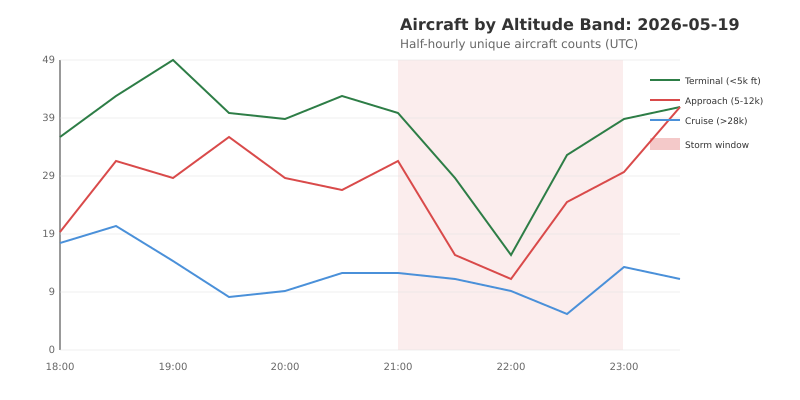
4. The 8,000 ft Marker
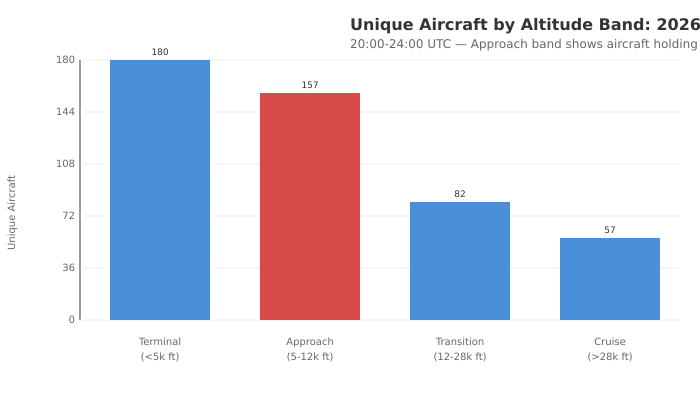
102 aircraft descended through the 8,000 ft marker during the storm window. The approach band (5-12k ft) shows aircraft stacking up in holding patterns rather than completing their descents to the terminal area. Terminal operations (<5,000 ft) dropped 60%. Cruise traffic (>28,000 ft) continued unimpeded — the signature of a ground stop.
5. FAA Ground Stop Correlation
The FAA ATCSCC issued multiple advisories for BOS on May 19. The timeline shows our ADS-B data captured the effect of the ground stop, not a precursor:
| Advisory | Time (UTC) | Time (ET) | Event |
|---|---|---|---|
| 085 | 19:22 | 3:22 PM | BOS arrival delays begin |
| 118 | 21:30 | 5:30 PM | First BOS Ground Stop |
| 129 | 21:49 | 5:49 PM | Extended flight plan drop times |
| 146 | 22:23 | 6:23 PM | Ground stop extended |
| 160 | 23:28 | 7:28 PM | 3,277 delay-minutes accumulated |
| 167 | 23:52 | 7:52 PM | Ground stop cancelled |
The ADS-B message drop at 22:00Z occurred 30 minutes after the first ground stop (advisory 118 at 21:30Z). This is the expected propagation delay — departures stop, then airborne traffic clears.
Source: Advisory 160 — 3,277 total delay-minutes, ground congestion on taxiways after brief reopenings.
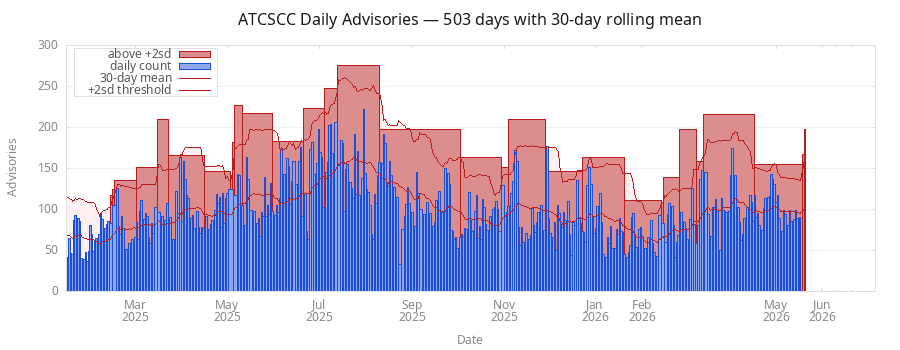
May 19 produced 167 ATCSCC advisories — nearly double the 90/day baseline. The chart shows it in context: a clear anomaly, though March 16 (216) was worse. Other airports also ground-stopped, but those are outside our receiver range.